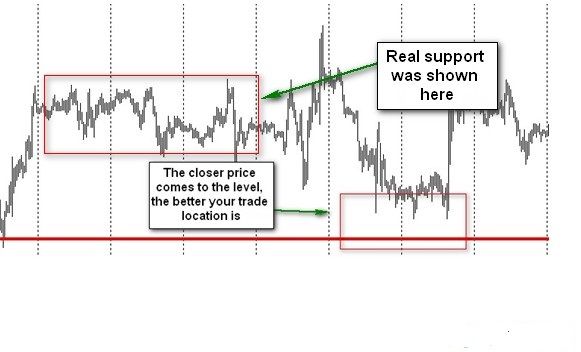
What is swing trading? How «swing trading» differs from «momentum trading»? Actually, there are many approaches to swing trading, but I will express my point of view on the subject.
Swing trading is trading on intervals more than 1-3 days, some traders may call it «long term» or «medium term», but in fact, good swing trade can last no more than 4-5 days. Swing trades are usually level-based trades. For example, if you trade momentum, you can capture short-term overbought or oversold condition of the market (imbalance) and trade-off scenario of inventory correction.
If you trade momentum, your trade will look like that:
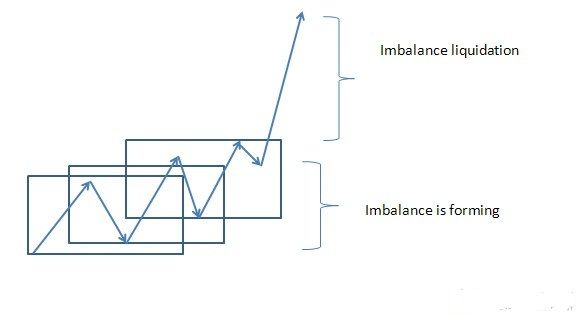
You see, that typically you will buy high to sell higher. But in this case you act like a sniper, wait for perfect timing for your entry, then aggressively go with the market, capture profit and exit.
Things are different with swing trading. For momentum trader it’s natural to exit pretty quickly (duration 3-4 hours for intraday trade) because his price is not relatively very good – momentum trader is unable to survive pullbacks, rotations and other activity of the market, before it reaches the target. That’s why momentum trader will tend to quickly reduce his risks, minimize stop losses or set them to breakeven.
Swing trader expects to get good price while his timing may not be ideal. If you expect to get good price, market can revisit your entry several times, rotate above your entry (if you go long), go sideways, and only after 2-3 days of sideways action price can break out from a range in the direction of your position (or may not break out)
Typical swing trade looks like that:
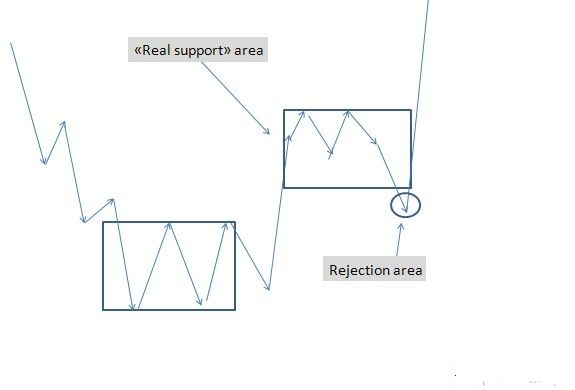
I basically trade 2 types of swing trades – «rejection trades» and «hot spot trades»
How do they look like?
In this post I will talk about "rejection trades".
Briefly, rejection is a reversal. It’s that simple. But there’s one small nuance. Rejection level is not a «support» or «resistance» level. Actually, there are no support and resistance levels – there are only areas of support and resistance. And they are usually located where majority of traders don’t seek them.
Important principle:
Before ever considering fading correctional move, you should see signs of support/resistance before. Sun Tzu had said: «Every battle is won before it’s ever fought»
The same is in trading. Every reversal is made before it’s occurred. Weird, huh?
Reversal is just a paradigm shift in heads of market participants. Before reversal, market must have strong imbalance between demand and supply, otherwise no power can drive the market against existing trend (even correctional)
So, to decide whether to join a trend or not, you should see signs of big money buyer (seller). As you know, institutional buyer will tend to accumulate, to slowly build his position. More often than not those guys are not speculators in conventional way – they accumulate position by given price, then use purchased asset in business outside the market.
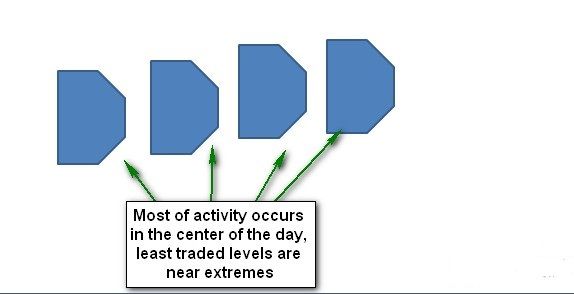
So, if you see that market tends to show you very well traded levels in the center of the day and poorly traded levels on the extremes of the day, it can be a sign of accumulation if this process goes long enough.
Look at the chart of AUDUSD – you have seen signs of big buyer accumulating long here – look how price is leaning to the area 0.9440. How do you think – why market shows strange consensus around this level?
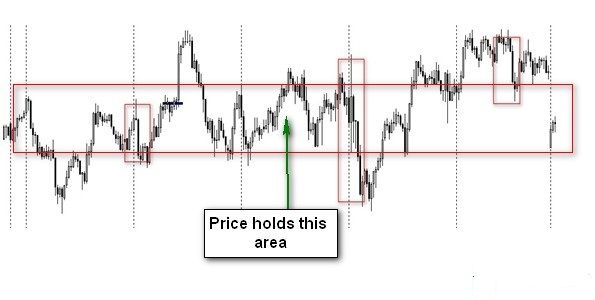
Also, you expect to see «neutral» or «normal» days as the process of accumulation goes on. Neutral day is day with very low tempo and aggressiveness – it closes near its open. Normal day is more aggressive day, yet it also closes near its open. These days also help you find accumulation areas on the chart
And there are other clues that I can’t describe here, because in this case post would become very massive. I call areas described above «real support areas». Why «real support»? Because those who join the market from any lines can’t really support the market – they are short term players and gamblers by their nature. Will gambler support any market? He is careless and he will exit first if something goes wrong.
Guess what I’m trying to tell you?
If you want to get good price and capture a reversal of correctional trend, you should seen signs of real support. Real support creates conditions for a reversal if market goes against big buyer (remember –to reverse the market, there should be supply/demand imbalance). Reversal itself occurs after paradigm shift, when it becomes clear for most short sellers that they were biased and go in the wrong direction.
Compare two situations. I specially applied market profile for those charts to show you the concept. On the first chart there are not enough real support clues - market goes back and forth in continuous search for information, on the second chart things are different – this chart is much more «managed» and probably driven by strong money buyer.
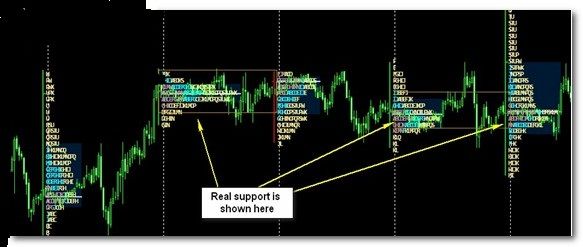
So, not surprisingly, price reverses below offering several good opportunities for a swing trader:
