Thursday, June 11, 2015

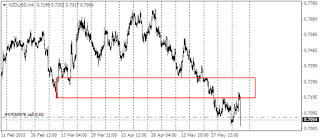
NewZealand Dollar Rate Cut by 0.25 bps l What's next

Newzealand bank cut the deposit rate by 25bps


After leaving rates on hold for 6 straight meetings, Finally RBNZ cut deposit rate by  25bp  to 3.25%. Dairy auction pricing has remained on the soft side and inflation expectations remain stuck below the 2% threshold, but the primary driver of the easing convictions is the announcement made with the latest RBNZ stability report. As expected the central bank sought to curb property inflation in the overheated Auckland area by boosting LVR requirements to 30% effective this October, thereby diminishing the primary deterrent to easier money.

<br>
- Along with decision on policy, markets will monitor the latest projections for growth, inflation, and 90-day bill rate forecasts made by the RBNZ on a quarterly basis. Last time in March, FY15 GDP was cut to 3.2% from 3.5%, CPI cut to flat from 1.1%, and 90-day billl rate target reduced 30bps to 3.7%
Reserve bank of newzealand cut deposit rates start Easing

Weekly Chart has lot to travel till it find the last imbalance point

Wednesday, June 10, 2015

usd/chf update l Possible Scenarios

Usd Franc Trade Updates Hi, Traders Its been a week since I have posted and I saw some strong movements in jpy crosses but they are not part of any technical moves because its more than fundamental that driving yen demand and pushing yen crosses lower.
It is not a cause of concern for me as I always trade what I see and I have seen some strong rejection of levels in Usd/chf and I don't care what Euro do in coming days or weeks I expect Euro to be lower and I have not seen any movement in Euro bunds which means strong or smart players are sitting aside and hence dollar demand can dominate any time.

Here is the Usd/chf chart update that I see


I will try and update as I have seen price flagging after rejection of strong demand and If this rally has to continue then we need another rally of that line which has some history in the past and I see only supply around 0.9440 so there is good amount of pips you can bag and risk is only 10-15 pips or psychological levels 93 cents which is just few pips away.

Trade Alert


Usd/chf trade closed with 52 pips. Check the updated chart with Trade plotter.

Friday, June 05, 2015

Englulf Candles l Power of One Candle

Power Of Engulfig Price Action

Trading Single Engulfing bars at Important Levels –
Trading Engulfing Bars only Can be Profitable

From today I will post daily engulf price action on Four Major Currency pairs and trade alert will also be posted. You just need to Stay Alert and watch blog from time to time for education as well as free trade alerts.

Eur/usd rally strongly from the base to origin of down move as It was part of Institutional trading that they set predetermined buying and selling areas specially when they use Engulf at Important levels.

During weekend, I will post Eur/usd Chart with possible Reversals with the help Of Engulfing Bars and other possible charts with trade entries and exit.

So keep checking the blog from time to time

Thursday, June 04, 2015

Forex Trading Strategy and Price Action

Hi, all

There are so many doubts in everybody's mind that If there is strategy that can make us consistent money and the answer is "NO", Because We all expected returns in big way and there are not too many day traders that fetch consistent returns unless who are having tons of experience and making that experience counts and knows their limitations .

It all about keeping things simple and Look to rely on simple naked charts to trade and keep a track record of your losses and wins and always use Money Management while entering and exit because Even simple RSI buying selling ratio should be good enough strategy to make money because when they fail you know when to exit and what are the chances of making a big trade with Strong money management techniques.

Question Arise from Expectations and when hard work don't met expectations then depression use to dominate and that is what the story of every retail trader and I am also the same.

Problem we face is that we check  so many social media networks with the same relative information and look  to search google  to see what is the best strategy and what is the consistent way of making money and We have to satisfy ourselves with bunch of traders are looking for the same sort of results.

I would advice you all to see the search engine with relative searches on the monthly basis on a same topic (say Forex price Action ) and you will be shocked  to see that whether there are people who know how to trade and the resources which tell them how to trade are worth it to give it a try.

I always believe in working alone or Same people working on same project but with divided  duties and every one should be answerable to his or her boss for the results and Forex is not the different because when we try to trade we always look for help and search or look out at forums for the views  and Trade Ideas of other traders and even do the worst loads lots of indicators for help to look for price action and see if it helps.

I believe in Keeping Your Trading Simple

The key to successful Price Action Strategy is to keep things simple. I am always against the complicated trading strategies and using lot of Indicators where you can hardly see the price or hardly consider price when you want to predict the price action. I used to trade the chart system like this :

Trading without indicators best trading strategies


In Simple words, the simpler your method would be, the easiest it would be enter and exit. Because if you rely on some indicators to react while looking to exit then it might react very late because they are lagging and always react to price.

My answer to all you complication is first open a naked chart and plot few support and resistance line and look how price behave to it when it touches or surpass them and there is no need to look way behind in reference to take a look at historical chart to catch the reaction.

I find that this is the best Forex strategy as the chart is clear and easy to understand and there is little to no noise distracting you from the price. This is one of the benefits of using a Forex system like this.

Japanese Candlesticks Patterns Do they help in Defining Trend Alone

Hi,
Most of the traders who follow my blog knows me what type of trader I am But I am also one of you who had torrid times trading and trade everything and First thing I try was Candlesticks Patterns.

 What is a Japanese Candlestick ?

While there is no need to explain this concept further as many of us are familiarize to this but I will surely dig in a little and discuss them more in detail in my upcoming posts.


Japanese Candlesticks Trading
Japanese Create their own old school Version of Technical analysis to trade rice. That's right, rice. Mr. Steve Nilson discovered this charting technique called "Japanese Candlesticks" learning from a fellow Japanese broker. Steve researched, studied, lived, breathed,at candlesticks,and start writing about it. and soon this technique became popular in 90's. To make this discussion short, without Steve Nilson Candlesticks candlesticks charts might have remained a buried secret. So, We can call this technique as Mr. Nelsonsticks.

Back in the day when Godzilla was still a cute little lizard, the Japanese created their own old school version of technical analysis to trade rice. That’s right, rice.

But Really If I ask you about my own experience then would you consider that Candlesticks patterns really help you define the trend, May be most of you really will raise your hands and say yes it did. But for me they do but not at all phases. Little movement at top will give some strong traders room to collect profit and again enter at better price and How would you tackle this type situations. Would you re-enter at second entry or consider first entry as best and would still trade failed test of top or bottom.

So for me, Trading alone candlesticks patterns is not the secret. Situation, patience and reason to Candlesticks is the best way to enter a trade.

Let me clear you with an example of Recent Aussie Chart .


See, Everything In trading is totally synchronize as Fundamentals allow trends to built and create a atmosphere where Technical are also supportive. For me, Its always been combination of Supply and Demand Areas and Reaction of Candlesticks when they reach or surpass the area and also the upcoming events that usually creates or reverse a trend..

But It does not happens everytime you trade because As I said earlier these all things are synchronized and I combine them with the recent market situations and demand and the speed of the trend on weekly and daily time frames and then I use negating techniques when price fall with the same pace it was rising and Candlesticks post neutral statges.

Gbp/usd chart that I posted last week fetch more than I anticipated and still looking for much more advance and I always recommend buying on dips even after Service Purchasing manager Index fall to 56.9 and It was expected much higher. But What happen with that bearish Engulfing pattern after the release.

Let's find out with the help of chart

Candlesticks bearish price action negated


So, Its quite clear after seeing the above chart that Candlesticks patterns not only thing to rely upon but situations and Imbalance is something that is driving the Price to one corner to other and this will keep happening on higher time frames and we just need to spot those scenarios where we can enter with low risk and chance of getting nice ride is much more than those large and strong fading candlesticks.

Tuesday, June 02, 2015

Gbp/usd chart Updated.

Gbp/usd Intraday Chart Updated First Of all I would like to remind everybody about my last month Chart Gbp/usd and take a look at the Chart Price has rallied to from that support which is mentioned in the above chart and Now I am still look for much stronger rallies towards 1.5800 levels where recent high is posted But that is not enough as I always look for strong levels and I would surely post the chart here again Once I saw any Institutional selling and Look to close all or part of my current positions.

How I trade Pinpoint levels in Gbp/usd


As You have seen in the Above chart, How I market levels in the chart and those are not just levels those are demand levels and Look How market approach to those levels.
It is Crucial from a trader's point of view that Market maintain Imbalance when It approached to those crucial levels and that is the fact which remains a secret to trading supply and demand and watch the last candle so strongly coming out of that lows tells us that you can't trust what you see as it take the stops of longs and Now people have to cover quickly out of shorts and looking to buy when breakouts occurs on shorter time frames.

Gbp/usd chart that I posted Earlier


Long Term View of the Gbp/usd


My long term view of Sterling or Gbp against dollar is still bullish because As you have seen I try to trade imbalance and Price has manage few swings in the past to fake the breakouts and that swing also is coming of lows of long term support and I am still looking for a move towards 1.6150 levels and there on I would like to see How price behave at those levels.

I am long from 1.5200 levels and still locked the trade at Breakeven and at no risk but still I would looking to trail my entry and start locking my profits as this counter-trend swing could be the strong off from the lows and one that rejects of from high posted a sell-off.
Eur/Usd Long term view

Popular Posts