Monday, March 31, 2014

Time to know What clearly the Imbalance IS ? For Intraday Trading


So, you know already that big guys rarely come to the market and buy all they want. They need to build their positions, sometimes in sideways market, sometimes on moving market.

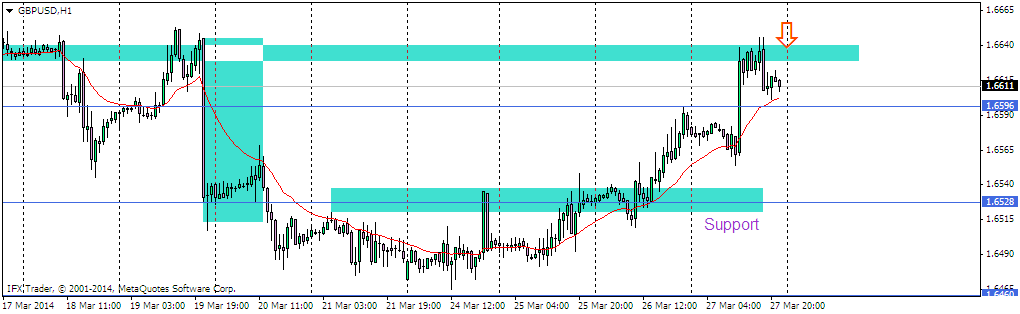
It's called accumulation. The opposite process (when they cover their positions) is called distribution. That's how market mechanics works. For example, if big buyer participates the market:
Big player accumulates positions, market is temporarily oversold on weak side, it breaks out from the range of accumulation, then rapidly pulls back, levels below are protected, market is bought out and highs are retested.
If later on we see market "leaning" on higher prices, it's a sign of possible imbalance - buyer is in control and if seller will not step in, market will continunue renewing highs.
Then you may see pullback again and if market "drills" lower prices, imbalance is possibly dissappeared - your opportunity no longer exists.
I am trying to clear the information that when you see price consolidate at the top after strong breakout, and you see it holding on to top and minor correction and value start building up again, You need to check whether price is trying to make a new high or trying to breakout from the range and If you saw sudden selling which could be part of liquidation or another accumulation. But If it is a part of strong momentum coming through after the test of recent low then price is still in Imbalance but a desperate selling without any long tails means imbalance has disappeared and now to check what will happen next
.
Try and Learn from this chart!

Intraday Update Usd/jpy Day Trading Makes it easy


Intraday Update of Usd/jpy Chart which is a part of day trading strategy and make trading easy as this level. If you look closely the chart we have seen breakout after lot of days and then when we see price holding higher prices and rapid move was following and when price breaks down for liquidation which means that absorption and accumulation phase and traping sell orders price breakouts and then again today consolidation at the top and tries to breakout and now may be culmination phase would be following.

Saturday, March 29, 2014


Real Time Update Time to take profits on newzealand dollar trade We might get another opportunity but supply has hit the market and we need better picture of range or momentum to go long again Check The chart.

Canadian Dollar Update


Example of how to trade violation in strong market With support fundamental Activity *Usd/cad Classic Momentum Example after strong Initiative break and then liquidation was very slow and Market react very slow near price extremes and After final breakout of range price start rising immediately and then test that development area and then sudden spike that was second opportunity to go long and with low risk high probability trade and that is the sort of market we should trade and that was classic example of imbalance as there was neutral activity followed by test and spikes.


Good Learning Process From these charts examples


1. Imbalance creates trends, balance creates trading ranges
Yes, exactly this sequence. Not "trend is your friend", but imbalance is your friend, because trend is an outcome, imbalance is a market condition that creates this outcome.
"Trend-oriented" mindset often pushes traders seek for bad trade locations, when opportunity no longer exists. Imbalance is what you really need.
Though trading is not a science, it has some unwritten laws beyond price action:
First - big market participants create trends and rely on fundamental analysis. Biggest players don't rely on charts in decision making process.
They have charts for just one thing - to know how crowd thinks and where majority will step in the markets. Big players need "hot spots" on the market (when many traders are in) to have liquidity. Their positions require liquidity and without liquidity they will be unable to accumulate enough volume for their positions.

Imagine player with pip size equal to 100.000 USD or higher. Of course, he will need liquidity and will build his position long enough.
That's why they monitor charts to know when traders will step in. But the reason they need to build a position is not techical analysis. Reason is fundamental analysis and analysis of real supply and demand.
It's hard to spot "big player" but one thing will help you. Address yourself a question - who loses on the market? Who is caught in short or long positions? If you understand that long players are losing, you automatically know that bigger timeframe short player opposes them.
Smart money players create imbalance and absorb volumes. Who provides liquidity, who consumes it? Like Warren Buffet said - if you find yourself near the poker table and don't know who loses money - it's you who loses it.
2. Keep an eye on hot spots in the market
What is a hot spot? They are: important extremums, round numbers, option barriers, in a nutshell - spots that traders are watching. If you know that volumes are there, big guys are also there.
Every trend can be divided into several parts - young trend, mature trend and culmination.
Young trend and culminational phase represent great imbalance but with one nuance - big players are building positions in young trend, and covering their positions during culmination.
If you see "obvious" trend and see very hot market, be aware - avoid being a laggard.
Take a Look at this chart
USD/JPY


Friday, March 28, 2014

Usd/chf buying at every LOW


Usd/chf one hour chart tells you the strongest demand after strong breakout and offers a pullback entry after neutral activity and liquidation at small development area and finally there was no selling and price advertising higher. USD/JPY I will update the text later.

Imbalance after strong spike at every Low


Eur/jpy chart tells us that we have strong demand in the place specially when price breaking out and spend few neutral days after breakout and In the rotation centre and try to violate it few times and you are end with breakeven or start covering your position and finally after liquidation breakout to the other side they start buy heavily at new lows and now I think it will test the upper boundary of resistance marked.

Prior development area boundaries can act as temporary demand

Euro Update

Price has touched the upper boundary of the development area
Quite Neutral Price action Still

New Update

Thursday, March 27, 2014

Test and Spike need more momentum to go through supply areas

. euro has shown no direction at the moment but a test of 1.3699 is on the cards.
.Take a Look at the chart price should trade below 1.3799 to break below 1.3699
.Momentum Neutral to Bearish.
.Break above 1.3825 will clear the bullish momentum
.I would remain bearish below and watch out for momentum candle to break below 1.3699.
Pound Update
Target 1.6653 reached price holding at the moment.

Kiwi Update

Update on Kiwi Dollar Entry was at 0.8575
Breakeven stops now move to 0.8631
Look to book all profits around 0.8700
Already Booked +57
Take a look at the chart

Wednesday, March 26, 2014

Long term views

Pound long term view In order to remain bullish we have to say above 1.6655 on Monthly Basis
Support on the downside 1.6527 followed by 1.6467 crucial on daily
Target has to be break above 1.6653 to test 1.6890
Update 1.6569 Has been broken Watch out for 1.6653

Update

Update of Pound4
Extreme Support 1.6466
Resistance 1.6569
Resistance 2 1.6890
Kiwi Dollar Update
Support is around 0.8575
Exteme support 0.8550
Price is still Looking for New Multi Year High around 0.8730 area Update Price test 0.8583 and flew after double hike in trade balance to our target

Popular Posts