Let's talk a bit about market fundamentals. If you want to survive and obtain ongoing success in trading, you'd better rely on fundamental principles that don't change not setups. There are bunch of setups over there, candlestick configurations and other stuff.
But if you know principles, you will be more flexible and your success will be more solid
What you can rely on trading markets?
Yes, exactly this sequence. Not "trend is your friend", but imbalance is your friend, because trend is an outcome, imbalance is a market condition that creates this outcome.
"Trend-oriented" mindset often pushes traders seek for bad trade locations, when opportunity no longer exists.
Imbalance is what you really need.
Though trading is not a science, it has some unwritten laws beyond price action:
First - big market participants create trends and rely on fundamental analysis. Biggest players don't rely on charts in decision making process.
They have charts for just one thing - to know how crowd thinks and where majority will step in the markets. Big players need "hot spots" on the market (when many traders are in) to have liquidity. Their positions require liquidity and without liquidity they will be unable to accumulate enough volume for their positions.
Imagine player with pip size equal to 100.000 USD or higher. Of course, he will need liquidity and will build his position long enough.
That's why they monitor charts to know when traders will step in. But the reason they need to build a position is not techical analysis. Reason is fundamental analysis and analysis of real supply and demand.
One thing will help you. Address yourself a question - who loses on the market? Who is caught in short or long positions? If you understand that long players are losing, you automatically know that bigger timeframe short player opposes them.
Smart money players create imbalance and absorb volumes.
Who provides liquidity, who consumes it? Like Warren Buffet said - if you find yourself near the poker table and don't know who loses money - it's you who loses it.
What is a hot spot? They are: important extremums, round numbers, option barriers, in a nutshell - spots that traders are watching.
If you know that volumes are there, big guys are also there.
Every trend can be divided into several parts - young trend, mature trend and culmination.
Young trend and culminational phase represent great imbalance but with one nuance - big players are building positions in young trend, and covering their positions during culmination.
If you see "obvious" trend and see very hot market, be aware - avoid being a laggard.
1. Imbalance creates trends, balance creates trading ranges
It's hard to spot "big playesr"
2. Keep an eye on hot spots in the market

Tuesday, April 29, 2014
Example of how Imbalance creates trends and balance creates ranges
Price Action Basics
Hi everybody! Let’s continue our study in price action and market logic.
How do you think, what is the main goal of the marketplace? Some would say – market brings together supply and demand, and that would be right answer, but it would be too abstract.
Liquidity – what trader needs to know?
The goal of the marketplace is not just to gather buyers and sellers and give them opportunity to trade, but to facilitate trading. What does it mean – to facilitate? It means that big market participants that mostly benefit from liquidity, will be interested in active trading from all types of traders.
The more traders are involved, the better execution large speculator or commercial trader will have.
Exchanges, for example, hire special companies, that are called «market makers» and pay them salary for keeping two-sided quotes – therefore every investor will be sure that he will be able to get a fill for his position.
But even though, two-sided liquidity providers are unable to keep market in a balanced state when there is some aggressiveness in the market and liquidity is not very high.
Trends often occur when there are not enough traders involved and market has to advertise more and more to attract liquidity. So, big market participants are often not interested in trends, they would rather prefer balanced state of market to have opportunity to slowly accumulate their positions. It’s tough job – to accumulate position on the rising market.
But we as traders are interested in trends, aren’t we? Of course, idea of a trend is different for day-trader and for position trader. Let’s now talk about short-term perspective.
See the picture below – how do you think, where liquidity can come to the market, in point A, B or C?

Obviously, points A and B are extremes of the bracket, and there are always traders that will try to fade extremes, as well as traders that will try to play breakouts.
In point «C» there are not too many traders involved – they don’t know how to calculate the risk and where to place their stops, that’s why I can call this area «no mans’ land» and areas at the extremes «hot spots of liquidity»
If market is trading without significant support from other timeframes, it will tend to go from one extreme to another, yet it’s tough to calculate risk at the extremes, because you don’t know who will win in short-term time perspective – buyers and sellers, buyers can create a breakout, collect stops of sellers, then market will go lower, or sellers can drive the market down and buyers will liquidate.
So, when the crowd is there, don’t expect that price action will be predictable and smooth.
In my own trading, if I see that market conditions are balanced, I rather try to work near «no man’s lands» in the direction to «hot spots» where I cover my positions.
Key here is aggressiveness – if market is aggressive and volatile and liquidity is not enough, it will tend to reach extremes – market needs liquidity, after all it is an auction which goal is to facilitate trading. Liquidity is located near hot spots – I exit there, I don’t know who will win and I even don’t want to predict it.
Monday, April 28, 2014
Price Action Basics and Its behavior
We would like to continue our studies on price action and Here I would like to tell you how apple trade went well although, there was strong selling after upside breakout, I was confident that buyers will step and move the price way beyond.
I want to start this post with this strange sentence. We will talk about trading logic. How do you make decisions? Do you look for signs of buyer and seller and act accordingly?
Keep you trading simpler !
Think about simple thing – price action itself (trend, movement) will not allow you to benefit from that. Some movements are continued, some are reversed. It depends on current market conditions, but probability of success will be close to 50/50 if you simply follow price action (subtract spreads and rapid volatility spikes and you will get perfect strategy for failure).
So, what works?
If you dig deeper than simply following price action, you will understand that supply and demand will drive the market. But supply can be short-term, then transform into demand and vice-a- versa. So, you have to rely on professional supply and professional demand and be able to distinguish it between other fluctuations.
All that we learn here is designed for that. Professional demand (or supply) in most cases is ongoing demand. But are we naive enough to think, that professional buyer will uncover his actions for you in easy identifiable and straight forward way?
No, they don’t do that! There are numerous attempts to capture signs of professional activity using volumes. Some traders think that if they have volumes, they have real information. Poor guys!
Volumes are also misleading. So, one can not be successful in trying to capture big buyer from the market… if he thinks in conventional way.
Market tells you a story and you should understand this story
Combining nuances and clues (even number of volumes if you like) in the whole picture.
Here are several examples:

1. Market breaks out from a level and keeps level above. You see strange passive behavior of sellers – market shows you levels with very low volatility and holds there twice! If sellers were interested in this market, they would probably responded immediately. But you see no participation – something wrong with the supply is going on here.
Therefore you can anticipate that big guys are buyers! They’ve collected all supply below and no one wants to go against them at least for a while.
Not surprisingly price breaks out to the upside again.
2. There’s neutral day after the breakout. If there were short-term traders who have made this breakout, they would liquidate pretty soon. But nothing happens – nothing at all! All day price goes back and forth with very low tempo. It means that probably those buyers were big (institutional) buyers. Every time you analyze the market, you make narrative. Be sure that your narrative is reasonable and relies on solid market logics There are some important principles:
1. Insitutional buyers will sell on the upside breakout (not downside)
2. Low volatility after high volatility (directional breakout) shows lack of participation. The less liquidity (participation) we have near current levels, the more odds that market will auction higher.
Is it complex?
Yes, it is. But this is mindset that requires from you some disbelief, some critical view, some commitment to dig deeper and see what is hidden. That what trading is about.
Update of the charts of Previous week
"I do it for a while and that should be the last update of trade setup for this month. Because feeling very stress and tired after back to back day night updates of the charts".
All the updates of the charts I posted during last week.
Let's take it one by one with the charts I posted last Week !!
First of all take a look at the chart Eur/usd

The chart of euro I posted last week and I told you when price fall of a strong trend, and the follow through does not seems encouraging then price use to find a first bottom and reaction from that bottom is quick enough to give you Idea of the "context" and that time it was correctional bottom and break out "Area of Protection" and finally It become a rotation center and that rally today had a good strong solid breakout to test at-least 1.3890 area.
Reaction time was minimal so we should have been ready with limit buy orders to pick such strong strengths and get out quickly if momentum fades out.
Secondly, take look at the chart Eur/CAD !!

I post that chart as My favourable chart of the week last week as I fetch good pips with a trade and that rally from the balance area was bouncing so strongly and finally it give another entry today at 1.5270 and ready to cover quickly or book some profits or take that momentum till the end of the day.
Next one of real interest is Eur/Nzd

Eur/nzd set up was strong and that setup had strong accumulation area and then breakout which did not had a follow through but downside rally was very slow and keep bouncing out of a new low on hourly and create another opportunity for balance market to get through that protection area strongly and If that type of momentum had to fade out then they should have reason of failure, otherwise you should keep buying on shorter-time frames.
Here is the update gbp/chf

Suddenly, a strong pair to watch as It is still not confirmed that trend is matured trend and ready to reverse on medium term. "Strong" rally after the top is seen, but that protection area giving support to the pair regularly, and Now it would interesting to watch how shorts follows up. I would remain short with small stops and if I am stop out then I would look at the bullish bar that reverse from here, And If it was another liquidate trap then it give us better opportunity to short at higher prices.
Eur/jpy trade update

The setup I mentioned, last Friday worked very nicely although there was a new low found but it was for a very short period but reading the context and taking low risk reward opportunity, should be the plan and when You read the complete chart and logic then you would found it useful to enter as I have found price "breaking the floor" and all the liquidate bullish engulfing trap succeed and Place a new low.
Price rebound, but rally from that low was fading so I expected a new low and that what it did. Though, I had to cover quickly as bullish engulfing from low was about to test the area again, though book the profit at 141.16
Saturday, April 26, 2014
How to evaluate your trading
The main reason of this post is that you should be aware of whether you are trading "good" or not? Because when you are aware of that then there are much better chances that couple of losses won't effect your overall result and your winning "ratio" is much more than you winning "percentage".
Let's emphasis more on that topic !
Question that every trader asks himself from time to time can sound like this – «Is my trading good»? In other words, is it robust, does it have the edge, will it be profitable in a long run?
Some beginner traders say – «it’s very simple, if you earn money, your trading is good, if you lose money, your trading is bad». But it’s not that easy in a world of real trading – good trading does not necessarily correlate with short-term profits, bad trading does not bring profits in short-term perspective.
We never know whether this trading is good or not if we don’t know whether these series of profits was a result of following trading plan or veering from it?
So, here we come to basic principle of trading – short-term results don’t matter too much, they can be result of luck. Think about it – best trading systems are not providing profit all the time, worst trading systems are not providing losses always.
Ok, but what if you don’t have rigid trading rules for entering and exiting positions? It’s reality for discretionary traders who use their judgement for making trading decisions.
Is it really impossible to evaluate your trading using your profits/losses distribution?
To answer this question, let’s divide trading styles on 2 parts:
1.
You see, that in this case trader has relatively small number of winning trades (maybe less than 30%), but he successfully covers his losses with 1-2 «home runs» (big swings). You see, in this trading style it’s not recommended to evaluate trading by short-term profit and we need more time to make conclusion – is this trading approach robust or not.
2.
Equity curve in this case will look like this:
You see, here we can have about 50/50 distribution – in every second trade we can get profit or at least achieve breakeven point. Why not 70/30 or 80/20?
That’s a dream of every trader – to have 80% of winning trades and also keep profit/loss ratio more than 2/1 (having average profit greater than average loss).
But there are no hidden hacks and shortcuts in trading – if we improve our frequency (quantity of winning trades), we lose magnitude (size of our profit becomes smaller). Some traders are proud that they have almost no losses or 95% of winning trades, but size of their possible loss can destroy entire account. Market is hardly predictable in short-term perspective. I personally don’t think that we should chase for high frequency of winning trades. If I will be able to get 50% of winning trades and keep 3/1 profit/loss ratio, I would be in hog heaven.
In short-term trading approach it's much easier to evaluate your trading by short-term results - the better you trade, the more winning trades you will have and vice -a-versa. That's why personally, I prefer short-term trading approach, because I can keep myself on track and quickly recognize that my trading has become defensive, too aggressive e t.c.
Starting from September 2013, my own track record of results is shown below (Every week I put down result in pips in special Excel file):
You see, my profitable weeks are almost equal to losing ones - I don't have "home runs" except one trade on XAGUSD (Silver). But frequency of winning weeks (I had 2 times greater number of winning vs losing weeks) allows me to survive in the long run (and to get profit) without "killing trades". And, what is even more valuable, I can quickly recognize when I'm trading poorly and correct my trading behavior.
Evaluating your trading
Trend-following trading approach:
In this trading approach, trader expects to have small frequency of winning trades, but his profits are much greater than average loss. For example, it’s ok for trader to have 6-7 or more consecutive losses, then to cover it with 2 trades. His equity curve will look like shown below:

Short-term trading:
By short-term trading, I assume that one can either day trade or hold position overnight but still have small duration of average trade (1-2 days). Of course, the less duration of trade we have, the less is our average profit per trade. Yet In this example, we can expect to have better frequency of winning trades. And correlation between good trading and immediate results is much better for short-term trading rather than for trend-following trading or other long term trading styles.

Price Reflects Everything
Is it right or not? In previous post I've shown moving average indicator as an example of how one can use price-value approach in trading. But this is just example, in reality, simple MA can't show you where value is. Let's say, MA calculates 35 closing prices (35 parameter). Do you think that every price is equal here? Area located at higher prices is more significant for the market because it attracts more volumes (aggressiveness).
So in fact weight of higher prices in calculation formula should be increased if we want to know where value is.
What am I trying to say?
Price can't reflect everything because not every price level is equally important for the market and that is why I firmly believe that support and resistance are temporary profit taking areas and does not reflect a trade location everytime.
The missing piece is time and volume
(we don't have volumes on Forex - tick volumes is not what we need, so we can make conclusions about volumes from price action - was it aggressive or not?)
If you will refer to price as to advertising mechanism, it would be much easier to understand what's going on on the market.
I will quote great trader and coach, Jim Dalton, that teaches his students in approach of auction market principles:
Price advertises opportunity
Time regulates this opportunity
Volume measures success or failure of this opportunity.
Friday, April 25, 2014
Eur/jpy technical Update.

What are the symptoms of a mature trend and by "mature trend" ,I means there is a chance of reversal to test the support again. We have seen breakout and price manage to hold high prices and then rapid moves. If you watch the chart closely then you always look for logic and what is the "Context".
For me, I have spotted out strong downside rally after the top with overall trend is bearish with correctional bottom (When price had a downside rally and spike again and test the low of prior bottom with a spike then it is know as correctional bottom)
Spike from that correctional bottom is strong and its not one it had two-three spikes and when we have strong and usually when we have breakout and such strong trend, then price use to "Gravitate" towards the high.
"Test" of high usually don't always means that it has to test the high as all the attempts had failed and price makes a new low and attempt to rise of that low now is not strong and no follow through
Price is ready to rally again to make a new low below its recent one and that would be strong rally and it could be another strong bullish so no harm in risking 20-30 pips (Very huge risk as I never risk more than 10-15 pips ) but still swing trading opportunity can really takes the momentum to strong bearish trend.
Chart of eur/jpy below tells what is Real "Context"
Intraday technical update of eur/cad
Technical opportunity with breakout faded out and momentum arrives again
Below I have posted the trade on basis of balance market . Pair is already in strong swing and exact trade location was within the rotation center and "Violation" of such rotation center give us an opportunity. That type of market gives us hints before desperation is shown and we indeed need to cover at first attempt. But the rise was on the cards with second attempt with successful test and momentum coming in again.
The chart tell us that if momentum faded out again then we probably would have lost minimum on that trade as it was high probability trade as pair was in uptrend.
Take a look at eur/cad chart below And for reference check my earlier post

Thursday, April 24, 2014
Apple rally to the upside has just started !
514.00 area hold the support and we finally got a break above 549.00
Value was building but short term share holders exchange stocks but finally it was bid for another spike to new multi month high.
Apple, One of the top Mobile Selling Brands and It had Area of Protection
Chat, here explain that why we should remain alert inside bracket activities and when price has no reason to continue to the downside rally.
Update is here !!

Technical updates of New Zealand Dollar Crosses
I will update all the new-zealand dollar Crosses for the rest of the week.
RBNZ has continue to attract the attention by increasing interest rates, thus means to say they apply the accomodative policy.
Thus, it should be crucial to know who banks and Institutions throughout the world accept this move, So that is why I think there should be lot of opportunities with all the crosses of the Kiwi Dollar.
Here, I have put some thoughts behind Eur/Nzd chart, which tells technical moves after the policy decisions

Wednesday, April 23, 2014
Technical update Of Intraday opportunities
Price has different variables for "swing trading" and "scalping" as they do differ from each other
scalpers get good profit on "liquidation" at resistance, While swing traders look for other variables like what background is telling.
When overall trend is up and we saw a false "breakout" of Intermediate bracket, and then we saw immediate rise and background is very good or we have possible accumulation before the price breakout and after some ranges look for possible equilibrium point where demand and supply are almost equal. "Advertising mechanism" signals there is not enough sellers and price has to rise immediately.
Where you should enter for Intra-day technical opportunity in Forex.
Take a look at the Eur/cad chart below which tells us why we should enter

While everything is explained in the chart but still it is higher time frame and we should be worrying to enter, where we should look at the possible "area of acceptance", and we should look for strong engulfing or bullish hammer after rejection or rejection.
Other things come in mind whether that momentum will be faded out or not ?
Then we should look for possible points why that engulfing will be faded out, and one strong point here is trend is not strong enough and we are in possible range and that engulfing is not a breakout candle, so if that faded out then it has to fade out immediately and you look at next candle where it starts and its wick,the wick of the candle cover 20% of that engulfing which means taking out small stops.
If that candle turns out to be strong engulfing again (which it did), Then 60% of the chance that this momentum will carry out through-out the day.
Tuesday, April 22, 2014
Strong trend An activity in between a rotation centre and breakout which faded out.
First of all I would present you the chart of last week which shows strong momentum out of rotation centre accumulation, which was "faded Out" Immediately.
Trader p$ychology is tells the mindset to trade logic and breakout which faded out was there to go against the breakout but It is not the way we should approach every faded out move.
Let's take a look at the example, First!

Pound has done the same activity as shown in the above chart !
Here it could be another intraday opportunity waiting ? because price has continously moving upwards of its opening levels, and that is the crucial thing to now what background tells and whether value is moving with price or now So, its worth to calculate you stops levels or look for momentum to enter and get out if it fades out quickly, but this type of momentum does had a carry till the end of the day or another day.

Intraday update of Eur/jpy
Classic Example of development area
This is a clear example of what smart traders are eyeing and their "existence" in the market and they are driving the price high and buying at low levels as I "explained" in my yesterday chart.
Take a look at this "Imbalnace" and this chart tells you that there was strong activity to move the price high and price spend most of the time near the highs Of An Intraday .
Strong rallies to the downside could be a part of "liquidation trap" and strong momentum force to cover short term traders and enter long and pick nice profits.
Take a look at the chart below and it explained the activity
This type of intraday activity is quite normal and we should only look for logics rather than mere observations, Because trading is all about logics and consciousness and where we can use small stops rather than looking for predetermined direction assumptions.

Technical analysis of Euro Dollar
Regular Update of the Intraday update of Euro!!
Overall picture of the Euro-dollar is quite confusing and Direction is still neutral. We have not yet seen strong rally to the downside, But every rally is being sold so technical analysis would tell us to sell the rally again. But trading Gap at the opening of last week can force the price to test the 1.3890 area.
Price has spend quite a lot of time in the rotation area around 1.3890 and 1.3790. A break above 1.3810 will still be a good hint for bulls but a break above 1.3825 will open the way towards 1.3890.
Take a look at the Simple Candlesticks chart of Euro dollar below

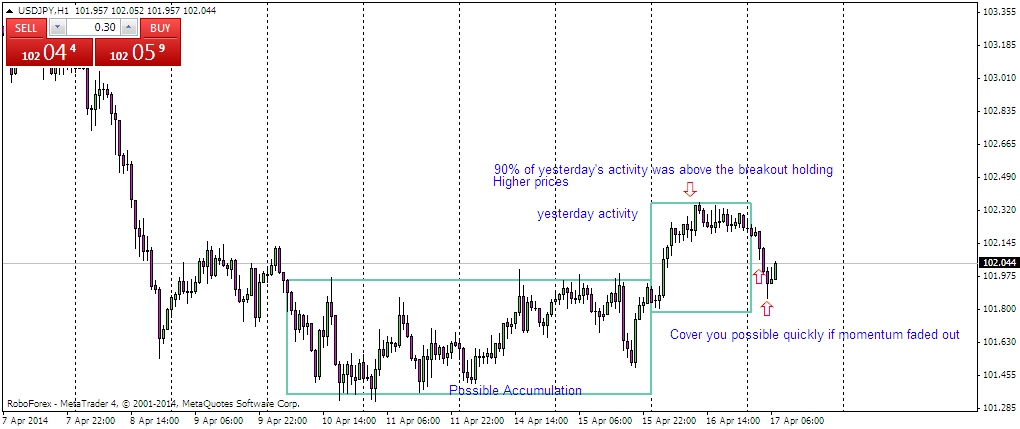
Technical analysis of the usd/jpy for Intraday Opportunity.
I have been forced to cover my usd/jpy longs as I have seen some failed breakouts at the top . "Analysis" should be based on Market Reaction. Any predetermined moves with stops at predetermined places can seriously forces you to give away all the profit you had earlier.I post yesterday that I went long around 102.05 area and breakeven stops were placed at 102.27, But situation and scenario has been changed as there is no development area after two neutral days activity,Strategies should be based on recent price action behavior rather than past activities,and the supply in the market force us to cover and traders are being forced to think of their long positions.
After range breakout strong bar has ended up with a Faded out.
If the overall trend remain bullish then surely today we could get another development and If I found out I would update my chart immediately, You just need to remain conscious and check the blog later
If that is a reversal then price has to break the floor which will
give us clue that Institutional efforts are here and they will keep selling all the rallies!!

Monday, April 21, 2014
Trading is easy but consciousness is very difficult !
Trading psychology and survival depends on skills and how you spot the trading activity of the strong holders out there. But when you have spend enough time looking for opportunities and when There does exist one and You timing is not right, and your consciousness is not upto the mark, then there is always chances that you feel discourage, but efforts always keep you upto the mark and keep you ahead of the market.
The recent Institutional activity has been spotted

What you need to do when you see a chart
Breakout
Whenever you first look at the chart first thing you do is to look at the overall trend , whether it is reversing, what price does after "Breakout", whether it is holding "higher Price". And second thing you need to know is was there any "liquidation"? Price is making higher highs in the chart. after breakout and you see liquidation involved here as well and after that value shifts higher. And Now new high is made and price reacting very slowly to the downside and it will probably rotate in the area for longer time.
Second thing to do to see how Price behave after breakout whether it falls immediately or holding the higher prices,and then what is the next move and if price liquidate immediately and rise again, then possible you will see immediate reaction, and by immediate reaction I mean rapid moves. Now It could be culmination or start of a new trend, Chart will give you Hints and you should always need to book some profits, when you witness such activity to ride the best part of a trend.
Whether price holding prices at top after breakout
Immediate Reaction means Momentum Comes to again push the price high
First clue of institutional activity is acummulation on moving market
Reading price action, it's important for us to estimate - is this action a result of institutional activity or result of any other activity?
First of all, let's break some popular myths.
Myth
Rapid move is a sign of big money buyer or seller.

Of course, in some cases, after news announcements or forced by circumstances, institutional buyers or sellers can enter the market this way,
But it would be a messy trade and their clients would not appreciate it. Yes, sometimes they are forced, sometimes they have no choice, but more often than not, they don't do it.
They need to build a position before.
So, if we see a rapid move, what is it?
It is emotional reaction of the market - it is a sign of crowd. Traders are acting in sync with each other and create a crowd.
More often, rapid move is a result either a short-coverage (move up) or long liquidation (move down).
WILL price action continue after rapid movement?
Actually, nobody knows that. It will depend on various factors and I would not bet money on it. Traders in whole are driven by linear logics. For example: "we see something volatile, it's a sign of big guys going to one direction". It doesnt' work that way. Big guys try to be ahead of the crowd.But IF there is a continuation of a rapid move AND series of new highs/lows, than probably it can be a sign of a single big player.
Why? Because market continues building in the favor of previous breakout, it often happens when sellers are too weak and can't create enough pressure to drive prices back to previous range.
So, you know already that big guys rarely come to the market and buy all they want. They need to build their positions, sometimes in sideways market, sometimes on moving market. It's called accumulation. The opposite process (when they cover their positions) is called distribution. That's how market mechanics works.
For example, if big buyer participates the market
Big player accumulates positions, market is temporarily oversold on weak side, it breaks out from the range of accumulation, then rapidly pulls back, levels below are protected, market is bought out and highs are retested.
If later on we see market "leaning" on higher prices, it's a sign of possible imbalance - buyer is in control and if seller will not step in, market will continue renewing highs.
Then you may see pullback again and if market "drills" lower prices, imbalance is possibly disappeared - your opportunity no longer exists.
Take a look at this chart where there was Imbalance which disappears when market break the floor.

Sunday, April 20, 2014
Trading Price Action basics buying at lower level.
Strong holders vs weak holders
Ok, now if we have distinguished weak holders from strong holders.
And what we really have to do - we want to know, at least to assume what professional players are doing. By professional players I mean dealers or institutions that have to consistently deal with big volumes and give their clients at least average good fills.
Institutional activity or strong Holders
When we are talking about institutional activity, we are talking about strong holders. That guys have almost unlimited buying power at their disposal, but it doesn't mean that they want take money from you, they usually have large order from their clients. It not always means that they want to purchase from weak holders, squeeze them and hunt for their stops.They just want to accumulate position not squeeezing price against themselves.
Example of Trading Activities
First of all, if you look at this chart, how do think, where (on what prices) institutional player was buying (if he was buying at all here)?

Expected answer is that they were buying at lower level.
But think about their volumes. They are big enough, and they simply would not have enough liquidity to build a position there. They usually have to accumulate - to buy several times, to absorb somebody's sell orders. Otherwise, they will not have enough liquidity and make prices grow immediately up.
Prediction price action with indicators
Most of you know me as a chart trader, operating almost without any indicators. But to synchronize our languages, I’ve decently webinar called «Price action and indicators». There I was talking about possible use of indicators – what indicators can be useful in trading?
First, of all, remember one simple thing:
Indicators do not identify any trend, they don’t tell you «what», they tell you «how». The hypothesis about possible trend is your responsibility. I’ve said "hypothesis" because there’s nothing to be sure about, and best traders know that they don’t know. They might think they know, but in reality they don’t know.
It’s very complicated question – how to identify a trend (trend that will tend to continue), I suggest that you read my posts called «Price action basics» in this section.
But once you’ve identified a trend, you can use indicators to fine-tune your entry, to pick better trade location, to calculate a stop or profit taking level. But they don’t do the job of identifying a trend for you.
Friday, April 18, 2014
Basics of Price Action applies only on forex or currency market.
Trading the market, you want to see something beyond candlestick charts, and you want to see - guess what? You want to see people, traders with their interests, fears and desires. Like one wise man said, "discover what makes people tick, and you will know what makes market tick"
Where are you trading?
First of all, there is a significant difference between stock market and markets that trade with leverage. Forex is one on those markets (but not the only one - there are futures, options, OTC derivatives and so on).Nature of retail Forex market is that real currency rarely trades here. We trade obligations (for example, we take responsibility to buy some currency after the trade, and deposite some money fot that. If we are mistaken, we give some money to the market, if we are right - we take some money from the market).
Numerous obligations (traders from retail traders) meet together and form a huge whole position, that liquidity provider must cover using other liquidity provider. That's how it works.
! The process of exchanging obligations is somewhat different from exchanging real goods.
Things are different in stock Market
Imagine you're trading a stock. Quantity of stocks is limited, and to go short you must borrow some stocks from its' owner. If you want to close your long position, you expect somebody to sell it (real stock). And that's why we have "short interest" on the stock market, it usually doesn't exceed 5% of the whole volume.

Things are different on Forex and futures.
You can sell almost unlimited number of contracts, so you don't need to borrow something from somebody. That circumstance makes analysis of supply and demand on Forex pretty different than on stock market.We can see big supply, but suddenly market reverses and all those short sellers start covering. Why? Because they need to do it - they have small pockets and should exit quickly otherwise they can blow up their accounts.
The same is with long positions - there are lots of weak holders, that have very close "pain point" - they go long, place very close stop and if they have no defense from "strong holders", market will probaly go after their stops, because there is always strong counterparty that can hold the level and prevent price from further rising (remember - they can place as many "sell limit" orders as they want.

Trading on Forex market is really the Art of analysing underlying inventory.
To start successfully find good trades, we should answer these questions from small check-list:
1. Who is responsible for price action? Strong holders or weak holders? (price will go in the favor of strong holder)
2. Is market oversold or overbought on the way up? (in the first case we have weak short sellers, in the second - weak long bueyrs)
3. Is market oversold or overbought on the way down? (in the first case we have weak short sellers, in the second - weak long buyers)
As a trader, you should know how to read inventory and to play on the strong side.
Remember, there are not only situations when we have "win-lose" situation and "strong-weak" market configuration, we can also have "strong-strong" market configuration, when market is careless about retail traders and their positions (this is when we have elongated trends).As a trader, you should know how to read inventory and to play on the strong side.
Thursday, April 17, 2014
Australian dollar and Newzealand dollar Short Scalps in Range Bound Trading
new zealand dollar price action update
Little update on downtrend resumption as I was eager for that trade and emphasis a lot on this setup for the past two days. Take a look at the chart and decide what one could have done wrong when someone is aware of "distribution". Take a look at the update chart below !

scalp opportunity of kiwi dollar as imbalance disappears in strong trend
As I mentioned in my previous post about imbalance and difference between short term scalps and swing trading offer lot of opportunities as mentioned in Post. Check it my last post Here !!
Short term momentum does give us lot of opportunity as we are told from start that we should trade what we see. Here I go short with the trading range as price action in ranges are quite repitative and when we dont find enough buyers in short term picture then price keep looking to strong demand areas to find how crowd reacts there.
Here is I have mentioned that longs were trap with strong range breakouts with bullish engulfing and price test the area and immediate covering was found and lot of downside momentum as well.
Here is the another classic example of buyers finally give away in range-bound trading and price finally repeat the price action again and range breakouts again to the upside and then again after find strong short term buyers sellers again step in and move the price to the downside again to the support 0.9340
Check it here!!

When suppliers can't move the price immediately specially because of strong uptrend then they will liquidate their position with strong bullish engulfing bar to sell from better price and Australian dollar move today was a perfect example of today, although second trap was much more valid as first was overlapped but idea was too sell with a strong bulk orders.
Take a look at the chart below !!

Momentum give you another entry to enter again as I mentioned in my previous post that we need to cover but next candle break above that faded out candle.
Take a look at the chart I posted first on the blog, Here I mentioned that price has spend 90% of the range to the upside, yesterday and when it happens and market is moving down slowly and certainly it find strong momentum from the previous day "Minor development Area", then we get a good high risk reward oppotunity to enter on momentum as I did here and I had to cover with only 12 pips.
Take a look at the chart !
As I have mentioned in my previous chart we should cover over position with strong momentum candle which was faded out and another bar could let you enter again as there are best chances of momentum to carry throughout the day as it did.
Take a look at the chart Below !!

Wednesday, April 16, 2014
usd/chf intraday Update short term reversal could be here.

Are we seeing the short term reversal in dollar franc currency pair or it could totally reverse the trend ?
When we see such activity when price react the same way as thought and then suddenly we have seen some momentum candle then market won't go down immediately. It will try and create panic and will absorb buy orders at some place and Now i am eyeing if price absorb buy orders as it has already taken the stops of longs and now it will try and create panic with some upside momentum and then continue down to challenge 0.8750 support
It could not react the way I am looking for, But certainly a very good opportunity for short term trader to make some good profits and learn as well for the future reference.
Usd/jpy daily Technical update
When we trade currencies, there is lot of people and banks watching daily activity not for entry purpose, but in order to absorb supply and put in orders and that is known as natural behavior as no-one knows what price will do.! Price spent most of the time above accumulation breakout area and then holding higher prices in U.s session yesterday and that was one the cards that down movement will be bought if it happens immediately in the first session.

Little update from usd/jpy longs,momentum was here but Now we have to cover the position because momentum is really fading out and loosing steam.
Have a look at the chart below. !!

Now price has got momentum and confirmation candle which is also strong, so I will prefer enter this type of scenarios which have logic and suits a trading style which tell you to cover quickly if momentum fades out, rather than setting predetermined stop levels.
Time to update usd/jpy daily activity after covering you can close the trade now with good 40 pips profit were risk was only 5 to 10 pips because you can't risk more than
that when you decide to cover !!

Trading is much more than just buy and sell and it really is about logic
Truth behind trading is that it not a "science". When someone offering free services then it does not mean that we should not use our skill to know the fact and there has to be logic behind it . Interpreting charts can be not very complicated, and I would say – good setups look pretty simple, but in most cases this simplicity requires eagle's eye and some practice like the one below !!

For my style of trading I have no room for reversals which may or may not happen at all and I try to spot the reversal too early and if it does not happen and price respecting the line of defense also know as "Area of Protection or Minor Development Area" i.e when we saw a strong momentum breakouts and price build in some area where it spike few times or may be twice and then it could be rank as minor development area and it could be inside a bracket or rotation center and any test or strong demand would surely means strong holders win the last day in range bound trading and today again they are ready for ride .
Let me give you simple example by chart ! Its Usd/cad chart which tells you exactly what happen as it was decided earlier what was one the cards prior to BOC policy decision.
Short term trading bias is very important for daily technical analysis purpose
How much importance do we consider to give our bias whether it is performance or whether it is "Directional". Aren't, we thinking of too far ahead and giving away short term profits away with that mindset. Let me tell you giving importance to short term profit strategies giving you much more to earn while momentum is there rather than looking for consolidation patterns like "Triangles" or any other "Chart Patterns".

Market makers hardly look at charts and they look at the chart only to see what crowd is thinking means what bunch of new traders do when there was no big market participation by them. So, It became equally Important to look out for strong "breakouts" and neutral days after strong activity happens on an Intra-day basis, while the overall price action is opposite of that day activity say, Reversal is happening on short Term prospective.
By the way, crowd doesn't necessarily mean lack of money on deposit. It only means that horizon of a trader is relatively small. In most cases, it’s short term traders who are responsible for initiative and liquidation breaks, because they are willing to buy and sell on support and resistance with fibonacci involvement
Value Need to move with price because all support and resistance levels are not important for market participants
Day activity should be kept in mind and traders look to apply indicators to see value and substitutes are MA or Bollinger Bands, But for me it is only "Prior Behavior" and context which sets values below is the example where you will see that according to bollinger bands applied traders should be selling but if you look at the range price show momentum and after liquidation it keep going higher and value was shift higher.

It occurs because of what I call «Inequality principle»
It claims: «Different price levels are not equally important for the market». Do you feel what I’m talking about? Moving average or Bollinger bands can’t distinguish what price levels are more important for the market – it’s responsibility of a trader. Missing piece is market logic.
But period in the red circle was a final auction, overall trend was rising and market was no longer able to stay inside of a trading range. When market lacks selling liquidity, when nobody is going to sell, it start advertising higher searching for sellers. We often see that price is leaning to higher extremes and holds on higher prices.
How do you think – if auction is in place, can we say that this area is equally important for the market as area from previous day? Obviously, it is not – if selling liquidity is not enough, market loses equilibrium and searches for new area where balance can be found. We may pay too much attention to this area, but Bollinger Bands respects is as any other areas –
If we rely on idea of value from Bollinger Bands, we should sell because «value» is located below price. But in fact, proper calculation should like described below: value should not slowly move up, but it should make fast «gap» and it’s location is going to be somewhere in the center of congestion

As you see, our scenario completely changes when we look at the chart this way. We now should go long, because value is going up!
Totally different scenario which tells us that even though value builds higher but overall trend and <"Context is also important">. In this case Price Breaks the range but with no momentum and we can say least that price test the high of elongated candle but that in trading terms has no Range breakout traps are best suited with this example when price broke to the upside and then break to the downside and value again shifting to the lower site with floor finally broken as no panic to buy on the downside candles.
Tuesday, April 15, 2014
Australian dollar possible the weak after possible Top ?
 Australian dollar is on its way to test the important support around 0.9200
*** here is a another update on Australian dollar movement. It is "Range bound" this week and we can possible see a test of high but as far as I am concerned we should be shorting rally now. Reason behind that setup is we have seen no momentum when pair falls and any upside rally lacks momentum
*** As I have earlier mentioned in my posts that when we saw strong patterns which don't get any follow through and buying and selling on support is probably weak holders effect and that is the reason I didn't post that chart but earlier liquidation candle followed by weak buying candles giving us a clue that possible top is in place around 0.9440 area.
*** We always look for the contribution of the strong holders and who are those holders, chart give us clue always. It's hard to spot "big player" but one thing will help you. Address yourself a question - who loses on the market? Who is caught in short or long positions? If you understand that long players are losing, you automatically know that bigger timeframe short player opposes them. Smart money players create imbalance and absorb volumes.
Monday, April 14, 2014
Gold intraday update Looking like possible top around 1332 area ?

Trade finally closed !!

***Strong belief is needed when you start shorting or going against the strong test and when you see such strong behavior at first site and reaction on second then it totally become necessary for you to immediate react to the failures. I would cover my position now at 1313 area *** Still the imbalance could be here but I am not too much concerned with future price as I always prefer to trade the recent price action and what chart and "Context" telling me to do.
Saturday, April 12, 2014
Basic of price action and how it behaves at different phases on an Intra day chart
*** What would you prefer ? Long term trading or short term trading as it is not really matter what you target because its approach that matters a lot and the reason is whatever you prefer should be profitable for you. State of mind and performance pressure really let you put in lot of stress and you keep changing your mind again and again, But price will react the same way which ever method your prefer.
***Many of you are familiar with concepts of «overbought» and «oversold» market. Conventionally, if price is going up and momentum is slowing down, we see signs of overbought market, and, the opposite – when price is going down and momentum is slowing down, we see oversold market.***
Reason I am pointing out these facts because it is the way we always use to approach the market and such overbought/oversold situation occurs only when market is dominated by short-term traders. But let’s first get familiar with concept of domination. What doest it mean, that market is dominated by short-term traders? It does not mean that nobody is there except short-term traders, it means that they are the driving force for the market.
*** By the way, short-term trader does not necessarily mean lack of money on deposit. It only means that horizon of a trader is relatively small. In most cases, it’s short term traders who are responsible for initiative and liquidation breaks. ***
If you we see movement that is going to be highly volatile and starting from inside of the trading range, it’s probably a «cascading effect» - something that is created by «fear of missing out» - many traders are chasing this movement and will lead to fast auction, raising prices higher and higher. In auction market theory it’s called "initiative break", it means that something is happening very quickly, with significant expansion in volatility, and maybe – volumes. But volumes can be not interpreted easily in this case. When volume is increasing (or decreasing) inside of the trading range, this information can be misleading, because there are too many types of traders participating inside of the trading range – from algos to scalpers, and increased volume can be a result of those guys’ over-trading
*** What about "liquidation break"? This is the opposite to "initiative break". It occurs when traders who have been involved in the action (during initiative break) are closing their positions. Usually, volatility is also increasing, traders are scared due to some news announcement or they simply put their stops below similar levels again causing cascading effect. Really, there’s nothing new under the moon – traders often act like a herd, and they rarely try to find their own particular niche and instead do what is comfortable and conventional – say, buying on the moving market and selling on the falling market.
***Now, what if market makes quick break from outside of the range of the day? It is called «responsive break». More often than not, responsive breaks represent activity of other timeframe traders who are building their positions using high prices (of course, short positions). We should take into consideration that other timeframe traders are not too urgent – they don’t want to push price down here and now, they understand that market has opportunity to go down in medium term time perspective and they want to be in this movement, but they are interested to accumulate inventory before the rally, that’s why they are acting upon a good price, but not expecting to get good timing for their trades.
Friday, April 11, 2014
Intraday or swing trading opportunity could be here Chart to watch!!!

Intraday trading strategies is done with logic and planning and we have to sort out our weakness and the cause behind trading whether you are a scalper or swing trade
***When we see an opportunity to trade, We look to see the logic behind it whether it is an intraday or Swing Trading. The best point is that it should be very low risk opportunity and If that is with the trend then it should offer you another chance to enter with even tighter stops if the breakouts or stops are taken out by few pips.
*** I have posted above the eur/jpy chart and when you see this chart it is trading with repitative patterns, breakouts to the upside and strong rally to the downside and range and then breakout
***When we see pattern like this we think of pattern getting repeat itself again, but most of the cases it did the opposite, so I would suggest you watch the chart closely and see if you can find some "Logic" behind this trade, range breakout was to the upside and follow-through was very strong at the first attempt, but it could do the complete opposite even with strong momentum breakout and the only difference is that we have seen a new low this time, and two to three attempts have been faded out.
***So, Watch the chart properly and don't be in any rush to trade that opportunity as there should be logic behind your trading and you just want to trade good with the trend opportunities and one could be here very soon !
Overall picture of Price Action should be clear when looking for intraday Chart or long term chart

** Are there ways to know in advance what is the complete context in overall price action ?
**In this post I would like to put more light on what is "context" which tells you what market is trying to do whether it has liquidated before or trying to accumulate further for next push to test the high or Low . ** It is necessary for a forex or currency trader to look the overall picture for intraday trading as it will make thing easier to get a long term success. The Chart I have posted here tells you what you should be looking for. **In the first attempt market trade location was lower low of correction which brought the spike and when it failed the market was in range for few hours and then immediate spike trap the new traders who think that "Candlestick Patterns" are best to trade patterns in any market. ** Market trap them and that is liquidation and see where market stops. Traders who have entered on pattern start recovering on next candle which was a large momentum bar with pattern and this suits best because market already was at new low and downtrend was confirmed. ** There are few examples I would like to post here today which tells you how important it is to know where the trade location situated and what are the reasons that you should enter a trade because market often gives you answers before making a next move otherwise there are no strong evidence that who is pushing the market in a range possible "Weak Holders".
Wednesday, April 09, 2014
Intraday trading and long term trading analysis have three phases

**As I told everybody earlier that trading has three phases Culmination, young trend and mature trend and Australian dollar might be a start of culmination process as background telling you that everything is clear for further gains.. ** Perhaps it could be too early too speak, but only time will tell and If my assumption is true 0.9390 could protect every rally or you can enter after test and strong rejection candles with momentum could be right way to approach.
**Amongst all the majors Only OZ is the one pair which path is clear and fundamentals are also supporting. * Would update the next analysis soon and everything is mentioned on the chart and you can ask if any question in your mind.
Price does gives you hints before reversing even is is strong Trend earlier

I do mentioned the reason few days ago that according to this chart, Price is about to reverse,because when we see enough reasons that liquidation does not have follow through which means Imbalance ( I have discussed it earlier on the blog) has disappeared and market has break the "floor".
Even when there was effort of buying with long wick candles, it stopped on next candle with very small effort and reattempt to continue was even stronger. This is the reason that newbie traders like to buy on pullbacks, with engulfing patterns which never arrives and they left stranded.
Check my Earlier Post Here !!!
Tuesday, April 08, 2014
Australian Dollar Is in Strong Demand Since last two days

This is considered as Strength in background !!!
As I have told you earlier when after a strong fall market tend to accumulate inside a bracket an start reacting to hot spot areas As I Mentioned in the Chart and when It react to intermediate where buyers and sellers have huge stop to dealt with, They probably decide to stay out and market lacking liquidation and value shifts higher to find the liquidation and finally accepting higher prices.
Then there was liquidation break at the top a strong pin bar, When background is as solid as this one, then we always consider entering at strong momentum areas and result was strong engulfing with strong rewards.
It could result in exhaustion but we have to wait and see if momentum fades then it could possible result in an mature trend, but its too early too speak. I will try and update the chart if there is any changes is seen, to keep you all updated.
Popular Posts
-
 It has been quite a long break trading but as I said that I have sharpen my trading as such that I can rely just on perfect setups to build ...
 -
Price Structure understanding and Measured moves Hi Traders, As Promised I have again come up with further advance level of educati...
-
 Protection area in technical analysis when there is a breakout Gold "Rise from Strong Demand Areas" And When we see moveme...
 -
 How to trade break away gap after accumulation In this post I would try to cover One way to trade the "Gap" In currencies...
 -
Forex Trading Strategies- Beginners Forex Trading Course Over years, there are millions of Forex Trading Strategies have been in...
-
What is swing trading? How «swing trading» differs from «momentum trading»? Actually, there are many approaches to swing trading, but...
-
Important to know your strengths and weakness Have you thought about this thing – do you consciously understand what is your best ...
-
 Convictions of Technical analyzing in depth «Price reflects all, trends will likely continue and history repeats itself.» I wou...
 -
Trade for a Living Truth Behind it The question people ask me most often is, not surprisingly, “Can I be successful at this?” Mos...
